
(RNS) — Support for President Donald Trump’s handling of immigration has dropped across all religious groups over the past year, with approval plummeting among White nonevangelicals or mainline Protestants, according to a new survey by the Public Religion Research Institute.

Faith leaders demonstrate against ICE tactics, in the departures area of Terminal 1 of the Minneapolis–Saint Paul International Airport, Friday, Jan. 23, 2026, in St. Paul, Minn. (RNS photo/Jack Jenkins)
Conducted in February and released on Thursday (March 26), the PRRI survey of 5,479 adults found majority support for Trump’s signature immigration policies is now limited to only two religious groups — White evangelicals and White Catholics. Even there, support has eroded since March 2025: White evangelical support fell from 78% to 69%, and White Catholic support sunk from 63% to 53%.
The most dramatic shift was among White nonevangelical Protestants; their support for Trump’s immigration policies plummeted nearly 20 points, from 64% approval to just 46%. PRRI defines this group as generally including White mainline Protestants, who make up about 13% of the U.S. population, as of 2024 — the same share as White evangelicals.
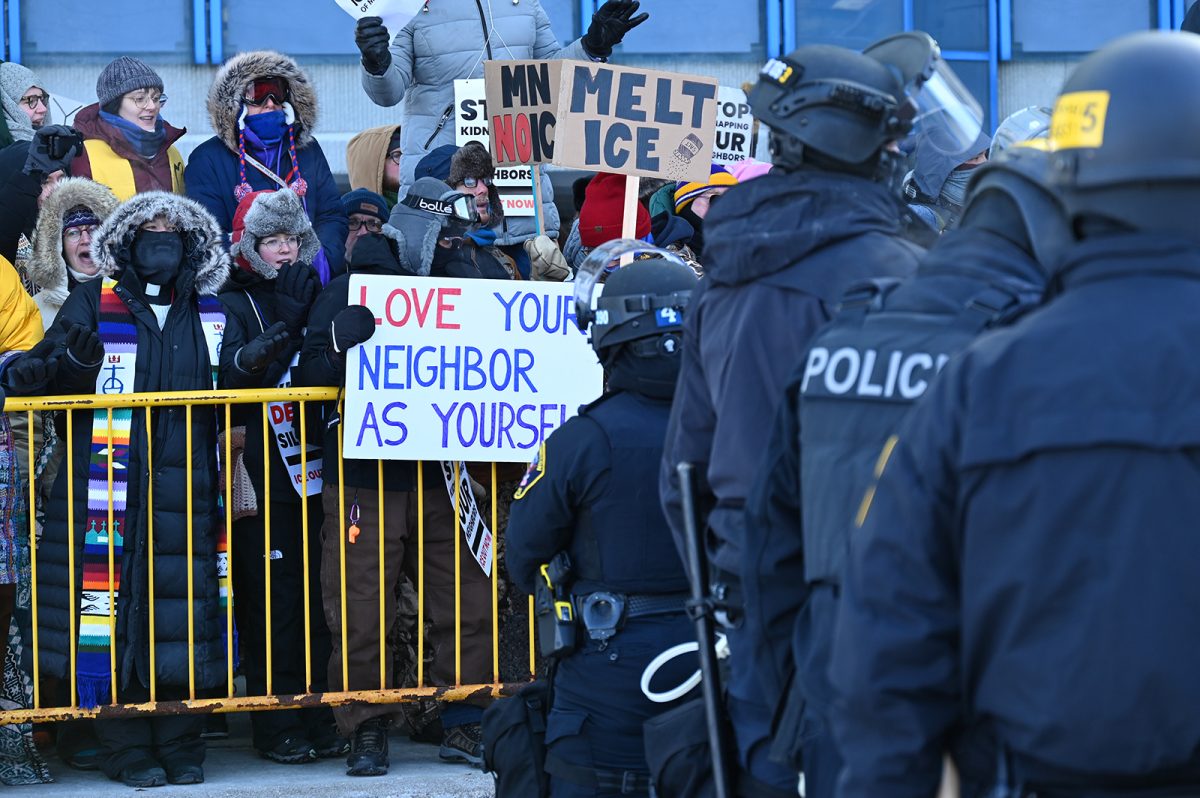
The shift among White nonevangelicals follows a year of mainline Protestant leaders voicing passionate opposition to Trump’s mass deportation efforts. The pushback began the first full day of Trump’s second term, when the Rt. Rev. Mariann Budde, the Episcopal bishop of Washington, preached a sermon with the president in the pews, asking him to “have mercy” on immigrants. Since then, a growing number of mainline Christian denominations and groups have filed lawsuits challenging various aspects of the president’s immigration policies, including rescinding a “sensitive locations” policy that discouraged immigration raids at schools, churches, and hospitals.
Mainline clergy have been a fixture of dramatic protests, such as when a Presbyterian minister made headlines after footage emerged of the pastor being shot in the head with pepper balls fired by Department of Homeland Security agents while he prayed outside an Immigration and Customs Enforcement facility. Many others have been arrested during demonstrations. Hundreds have also been trained on how to peacefully push back against DHS, even as the administration has mocked some of those protesting on social media.

“Views on Trump’s Handling of Immigration, 2025 and 2026, by Religious Affiliation” (Graphic courtesy of PRRI)
Support for Trump’s handling of immigration also fell among Jewish Americans, from 39% to 30%, as well as Hispanic Protestants (34% to 23%), Hispanic Catholics (29% to 19%), and Black Protestants (29% to 15%). The little support for Trump’s agenda that existed among religiously unaffiliated Americans also eroded, from 35% to 21%.
Individual pieces of Trump’s immigration agenda fared no better. No faith group polled showed majority support for allowing federal agents to conduct surveillance at hospitals, school,s and churches — although White evangelicals were the most supportive of the idea (44%).
On other topics, White evangelicals appeared to be an outlier, often joined by White Catholics. Majorities of White evangelicals (63%) and White Catholics (55%) supported the idea of placing undocumented immigrants in “internment camps” until they are deported, as did roughly half of White nonevangelical Protestants. Only one faith group supported allowing ICE to relocate undocumented immigrants to detention centers in states far from their homes without allowing them to challenge their detainment in court: White evangelicals (51%). Next were White Catholics, with 43% supporting the idea.
White evangelicals and White Catholics were also the only two faith groups who did not show majority opposition to allowing ICE agents to conceal their identities with masks and unmarked cars: Among White evangelicals, 39% opposed the idea, as did 48% of White Catholics. Meanwhile, most White mainline/nonevangelical Protestants (52%), Hispanic Protestants, (67%), Jewish Americans (68%), Black Protestants (77%), and Hispanic Catholics (78%) rejected such practices. Most religious groups also did not support increasing funding for ICE, with only White evangelicals (66%) and White Catholics (54%) showing majority support. By contrast, only 36% of the general public backed increasing the agency’s funding.

“Support for Increased Funding for ICE, by Religious Affiliation” (Graphic courtesy of PRRI)
The survey hinted at a potential ideological reason for the sustained support among White evangelicals. White evangelicals were the only faith group to show support (60%) for the “Great Replacement Theory,” the idea that immigrants are “invading our country and replacing our cultural and ethnic background.” Slightly less than half of White Catholics (47%) said the same, as did 43% of White nonevangelicals, 25% of Black Protestants, 24% of Jewish Americans, 23% of Hispanic Protestants, and 17% of Hispanic Catholics.
The survey also pointed to potential connections with support for Christian Nationalism, an ideology that other PRRI polls have found is most common among White evangelicals. Among Americans who are most supportive of the ideology — those whom PRRI calls “Adherents” — 70% expressed support for the Great Replacement Theory, as did 58% of “Sympathizers” of Christian Nationalism. Those numbers closely matched support for Trump’s immigration efforts overall: 70% of Christian Nationalism “Adherents” and 60% of “Sympathizers” still voiced support for the president’s performance on the issue as of February.
Even so, Christian Nationalism alone may not explain the approval of the president’s mass deportation campaign. Hispanic Protestants, a group Trump courted heavily in both of his presidential campaigns, have also shown broad support for Christian Nationalism in PRRI surveys — they are second to White evangelicals, with 24% classified as Adherents and 30% as sympathizers. But the group now broadly opposes Trump’s immigration agenda, with the survey showing fewer than 1 in 4 backing his handling of immigration overall.